
Understanding Moving Average Convergence Divergence (MACD)
What is Moving Average Convergence Divergence (MACD)?
The MACD (Moving Average Convergence Divergence) is a popular momentum indicator used by intermediate traders to identify potential buy and sell signals. Developed by Gerald Appel in the late 1970s, MACD combines elements of trend and momentum to signal the strength, direction, and potential turning points of the market.
Components of MACD
MACD is composed of three distinct elements:
MACD Line:
Calculated by subtracting the 26-day Exponential Moving Average (EMA) from the 12-day EMA. It highlights the short-term momentum compared to longer-term trends.Signal Line:
A 9-day EMA of the MACD line. This line serves as a trigger for buy and sell signals.MACD Histogram:
Represents the difference between the MACD line and the Signal line, providing a visual representation of momentum shifts.
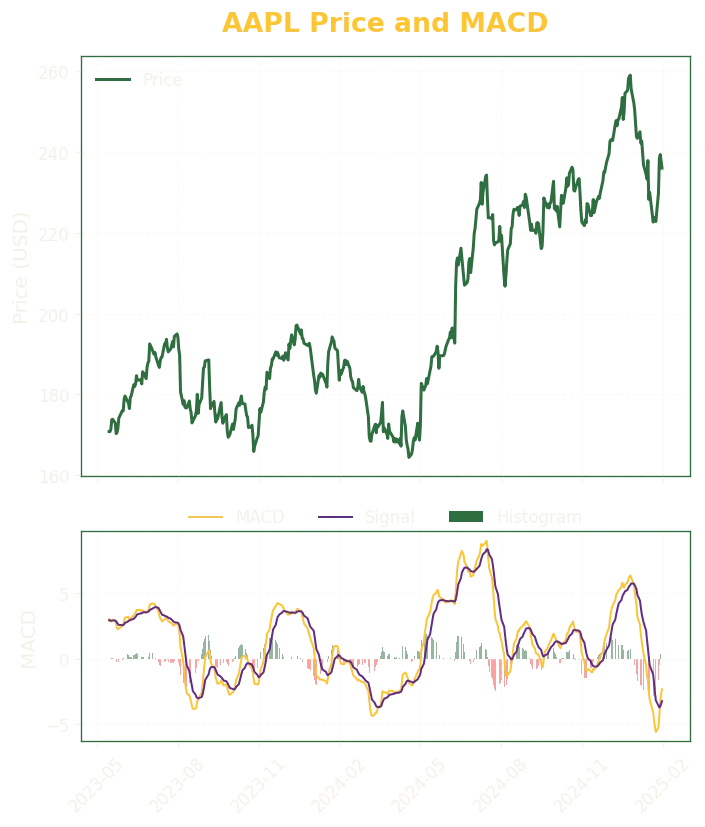
Chart Walkthrough:
AAPL Price with MACD
The provided chart illustrates Apple's stock price (AAPL) alongside the MACD:
MACD Line (Purple Line): Tracks momentum.
Signal Line (Orange Line): Indicates potential entry/exit points.
Histogram (Green/Red Bars): Highlights momentum changes, green for increasing positive momentum, red for negative momentum.
Interpretation:
Identifying Bullish and Bearish Crossovers
Bullish Crossover:
When the MACD line crosses above the Signal line (purple crosses above orange), indicating potential bullish momentum and signaling a possible buying opportunity.
Bearish Crossover:
When the MACD line crosses below the Signal line (purple crosses below orange), indicating potential bearish momentum and suggesting a selling or short-selling opportunity.
In the AAPL chart provided, clear bullish crossovers are followed by sustained price uptrends, while bearish crossovers precede downward trends.
MACD Divergences
Bullish Divergence:
When prices create lower lows, but the MACD line makes higher lows, suggesting weakening bearish momentum and potential trend reversal upwards.
Bearish Divergence:
When prices form higher highs, but the MACD line forms lower highs, signaling weakening bullish momentum and possible trend reversal downwards.
Practical Applications
Traders typically apply MACD in the following strategic contexts:
Trend Following: Confirming trend direction and strength.
Momentum Trading: Identifying strong market moves and potential reversals.
Example MACD Signals:
Bullish MACD Crossover:
AAPL experiences upward momentum, MACD crosses above the signal line, triggering a buy signal.
Bearish MACD Divergence:
Prices peak higher, but MACD does not confirm, alerting traders to potential price correction or reversal.
Best Practices:
Parameter Tuning
The default parameters for MACD (12, 26, 9) have proven widely effective. However, traders can experiment with different settings for varying market conditions:
Shorter periods (e.g., 8, 17, 5) increase sensitivity and responsiveness.
Longer periods (e.g., 19, 39, 9) reduce false signals in volatile markets.
Confirming MACD Signals
To enhance MACD reliability, always use it in conjunction with other indicators like RSI (Relative Strength Index) to validate potential signals:
MACD bullish crossover combined with RSI above 50 confirms stronger bullish momentum.
MACD bearish crossover accompanied by RSI below 50 strengthens the bearish signal.
Limitations:
While MACD is a valuable indicator, it has certain limitations:
Lagging Indicator:
MACD is a trend-following indicator, meaning it is inherently lagging and may generate signals after a move has already begun.
Whipsaw Signals:
In choppy or ranging markets, MACD can produce false signals, leading to potential losses.
Parameter Sensitivity:
Adjusting the default parameters can significantly alter signal accuracy, requiring backtesting to optimize settings.
Lack of Volume Analysis:
MACD only analyzes price data, excluding volume, which can provide essential confirmation for trend strength.
Conclusion:
MACD is a robust and versatile indicator, providing valuable insights into market momentum and potential turning points. By understanding its components, interpreting signals correctly, and pairing it with complementary indicators, traders can significantly enhance their trading strategies and decision-making confidence.
Connect
Join our community for trading insights and support.
Subscribe to our blog
contact@tinkertailored.ai
© 2025. All rights reserved.