
Understanding Relative Strength Index (RSI)
What is Relative Strength Index (RSI)?
The Relative Strength Index (RSI) is a momentum oscillator created by J. Welles Wilder Jr. that gauges the speed and magnitude of recent price moves. RSI oscillates between 0 and 100, helping traders judge whether an asset is overbought (potentially due for a pull-back) or oversold (possibly set for a rebound).
Purpose and Calculation
RSI helps traders:
Identify overbought and oversold market conditions.
Detect potential trend reversals.
Confirm momentum shifts in prices.
The RSI typically uses a 14-day window, calculated with the following formula:
Where RS (Relative Strength) is the average of gain over the average of loss during the specified period (usually 14 days).

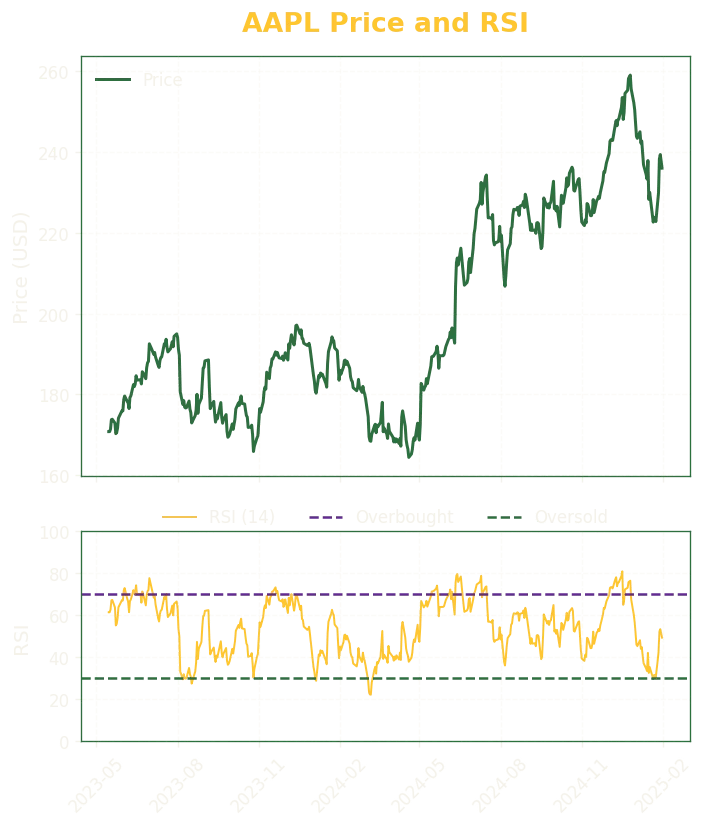
Chart Walkthrough:
AAPL Price with RSI
The provided chart illustrates Apple's stock price (AAPL) alongside the RSI:
RSI Line: The yellow line represents the 14-day RSI, fluctuating between 0 and 100.
Overbought Threshold (70): When the RSI crosses above 70, it indicates potential overbought conditions, suggesting the price might be due for a correction or reversal.
Oversold Threshold (30): When the RSI dips below 30, it signifies potential oversold conditions, hinting at a possible rebound or upward reversal.
Interpretation:
From the chart:
Notice how when RSI crosses above 70, the stock often experiences downward corrections shortly thereafter.
Similarly, when RSI dips below 30, price often stabilizes and rebounds, indicating buying opportunities.
Practical Applications
Traders typically apply RSI in the following strategic contexts:
Trend Following: Validate the direction and persistence of a trend.
Momentum Trading: Detect strong moves and anticipate possible reversals.
Example RSI Signals:
Bullish RSI Oversold Rebound
RSI dips below 30, then turns upward and re‑crosses the level—signalling renewed buying pressure.Bearish RSI Overbought Reversal
RSI rallies above 70, flattens, and rolls over—warning that upward momentum is stalling.Bullish RSI Divergence
Price prints a lower low while RSI forms a higher low, revealing hidden strength that can precede an upside reversal.Bearish RSI Divergence
Price hits a higher high but RSI produces a lower high, hinting at momentum exhaustion before a downside move.
Best Practices:
Customize the RSI parameter according to market volatility. For highly volatile stocks, shorter windows (7-10 days) might provide quicker signals.
Always use RSI alongside additional indicators or price patterns for confirmation.
Pay attention to RSI divergences (price moving opposite RSI), as these can strongly indicate upcoming trend reversals.
Limitations:
RSI can remain overbought or oversold for extended periods during strong trends, producing premature signals.
Short‑term spikes in volatile markets may push RSI to extremes without meaningful trend change.
By integrating RSI into a broader toolkit, traders can sharpen entries and exits while avoiding many of the false positives that isolated RSI readings may generate.
Connect
Join our community for trading insights and support.
Subscribe to our blog
contact@tinkertailored.ai
© 2025. All rights reserved.