
Understanding the Simple Moving Average (SMA)
What is a Simple Moving Average (SMA)?
The Simple Moving Average (SMA) is one of the most basic yet widely used technical indicators in trading.
It smooths out price data to identify trends by calculating the average closing price over a specified period.
Calculating the SMA:
Step-by-Step Example
Calculating a 50-day SMA involves summing the closing prices of a stock for the past 50 days and then dividing this sum by 50.
Example:
Consider the closing prices for the last 5 days (for brevity):
Calculation: (240 + 245 + 238 + 242 + 244) / 5 = 241.8
For a 50-day SMA, repeat this calculation with 50 days of data (or any other time period length).
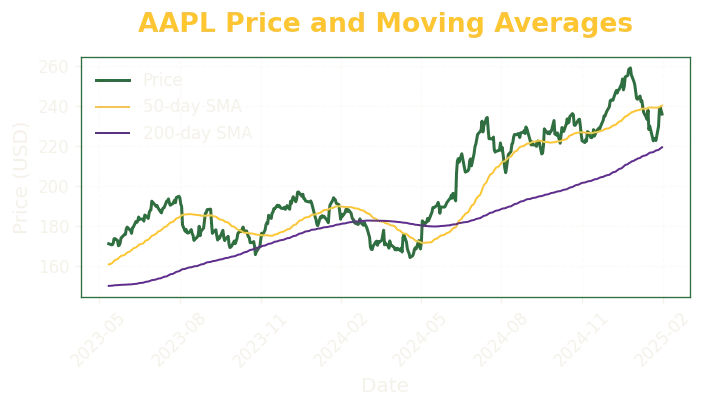
Chart Walkthrough:
AAPL Price with 50-Day and 200-Day SMAs
The provided chart illustrates Apple's stock price (AAPL) alongside two SMAs:
50-day SMA (yellow line): Reflects medium-term price trends.
200-day SMA (purple line): Reflects long-term price trends.
Interpretation:
When the price (green line) is above the 50-day SMA, it indicates a short-to-medium-term bullish trend.
When the price is above the 200-day SMA, it indicates a long-term bullish trend.
Points where the 50-day SMA crosses above the 200-day SMA signal potential bullish momentum (known as a "Golden Cross"). Conversely, when the 50-day SMA crosses below the 200-day SMA, it can indicate bearish momentum ("Death Cross").
In the chart provided, you can clearly see:
A sustained bullish trend from early 2024, confirmed by the 50-day SMA rising above the 200-day SMA.
Potential areas of support and resistance are identified by where the price interacts with the SMA lines.
How to Use SMA in Trading
Identifying Trend Direction
An upward-sloping SMA indicates a bullish trend.
A downward-sloping SMA indicates a bearish trend.
Spotting Support and Resistance Levels
SMA lines often act as support during uptrends and resistance during downtrends. Traders frequently use these points for entry or exit strategies.
Executing Crossover Strategies
Golden Cross:
Buy signal when a short-term SMA (e.g., 50-day) crosses above a long-term SMA (e.g., 200-day).Death Cross:
Sell signal when the short-term SMA crosses below the long-term SMA.
Practical Examples
Trending Market:
When a stock consistently trades above its rising 50-day SMA, traders might use pullbacks to the SMA line as buying opportunities.Ranging Market:
In sideways markets, the SMA often oscillates horizontally, acting as dynamic support and resistance. Traders may buy near support and sell near resistance levels defined by the SMA.
Best Practices:
Always combine SMA signals with other indicators or analysis methods (e.g., volume, RSI).
Adjust SMA periods to align with your trading timeframe (shorter for intraday, longer for swing trading).
Limitations:
SMA is a lagging indicator—it reflects past data, not future prices.
It can generate false signals during volatile or choppy markets, leading traders into whipsaw trades.
By understanding and effectively integrating the SMA into your trading toolkit, you enhance your analytical capabilities and increase the probability of informed trading decisions.
Connect
Join our community for trading insights and support.
Subscribe to our blog
contact@tinkertailored.ai
© 2025. All rights reserved.